That's not a California address. Enter a new address or start with one of these:
Look up drought report cards for California’s urban water districts
To address California's multiyear drought, Gov. Jerry Brown ordered a 25% cut statewide in urban water. Individual urban water districts, depending on their history of water use, have been ordered to reduce water consumption between 4% and 36%. The State Water Resources Control Board reports each district's progress on a monthly basis. In March, urban water districts used 24.3% less water statewide than in the same month in 2013, up from 12% in February. The cumulative reduction since June of 2015 has been 23.9%
goal*
Providing water to a population of 0, the 0 is part of the 0 hydrologic region. Based on residential water consumption in summer 2014, the state has ordered this district to cut 0 of its total water use compared with 2013*.
How did the 0 perform in 0?
0
The 0 used 0 gallons in 0, the latest monthly data available. 0 total water use for the district 0 compared with 0 2013. Cumulative water use since June has 0.
2013 (used for comparison)
2015-2016
How much of this is residential use?
State officials will judge compliance with conservation orders based on a district's overall total water consumption, which, in addition to residential use, includes commercial and industrial consumption as well as water lost to leaks and firefighting. For the 0, residential use made up 0 of total water consumption in 0.
How does the state measure residential use?
According to the latest data from the state, each resident of the 0 used, on average, 0 gallons of water a day, a measurement referred to as R-GPCD (residential gallons per capita daily).
How many gallons are used for typical water uses?


How does residential use compare with the state average?
When it comes to residential gallons per capita daily, the 0 is 0 the state average for 0.
How do residents in this district compare to nearby districts?
State water officals say that many variables—including rainfall, temperature, lot size and population growth—should be considered when comparing residential water consumption. The State Water Resources Control Board used the residential gallons per capita daily figures as the primary measure to establish conservation targets each district must meet.
… or to notable districts in the state?
For 0, the water district with the lowest residential daily water use was the 0, while 0 recorded the highest. Residential water consumption for the largest cities in the state are also shown below.
Look up a water district in California
Look up one of the biggest districts: Los Angeles | San Diego | San Francisco | Sacramento
 How what you eat demands more water than you think it does
 Run the L.A. Marathon without ever breaking a sweat
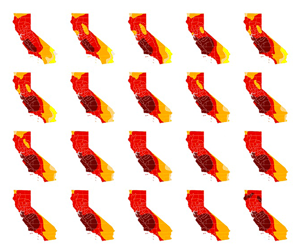
 California's worsening drought
 6 Girl Scout Cookies you thought you were getting but aren't