Discovering Gale Crater: How we did it
Remember when virtual reality first became a "thing?" We loved Snow Crash and Lawnmower Man. We were pumped. Then we waited — for 20 years.
Now, we finally get to play in that sandbox. We built the tour of Gale Crater to discover how journalism could succeed in virtual reality. It presents new opportunities for telling stories and, possibly, a new platform for consuming and distributing news in the future. And besides, it’s kind of amazing to be able to fly around another planet on your phone.
Even before we wrote any code, developing the project presented its own challenges. We started with the question: How do you tell a story where a user can move and interact in 3-D space?
Then we considered, and answered, a number of other questions:
- Should users be guided through the crater or able to explore on their own? In the end, we offered both because we wanted both. We suspect others will as well.
- Should we use text in the tour and, if yes, how much? Lengthy text is difficult to read and taxing to render in a 3-D scene. As a result, we kept the text short.
- So how to deliver information about what is being viewed? We opted for narration, which felt like a more natural experience. NASA's Fred Calef, known as "Keeper of the Maps" at the Mars Science Laboratory was a perfect fit for the voiceover.
- "Should it be a game?" We decided against making it a game but knew we definitely needed game-like elements. The language for navigation in 3-D space already exists in games so it makes sense to adopt those concepts. And if a project feels like a game, we suspect people want it to act like one in some respects.
Choosing a platform
Currently, multiple proprietary standards for building VR experiences are competing for dominance, many of them app-based. We felt that in many cases, making users download and install an app produces an unnecessary barrier to entry. Building a browser-based app allows anyone with a reasonably modern, WebGL-capable browser to take the tour or explore the crater - whether they're on a desktop, tablet or mobile device. Meanwhile, if someone has a Google Cardboard or an Oculus, they can enjoy a more immersive experience.
At the L.A. Times Data and Data Visualization desks, we prefer open Web standards, so the entire project is built with open content: The elevation data and images are from NASA. The project is constructed with HTML, CSS and JavaScript, including the open-source Three.js, which is used to generate 3-D scenes in JavaScript, and the excellent WebVR Boilerplate by Boris Smus.
But let's get to the fun stuff. How did we recreate the surface of another planet?
For the Record
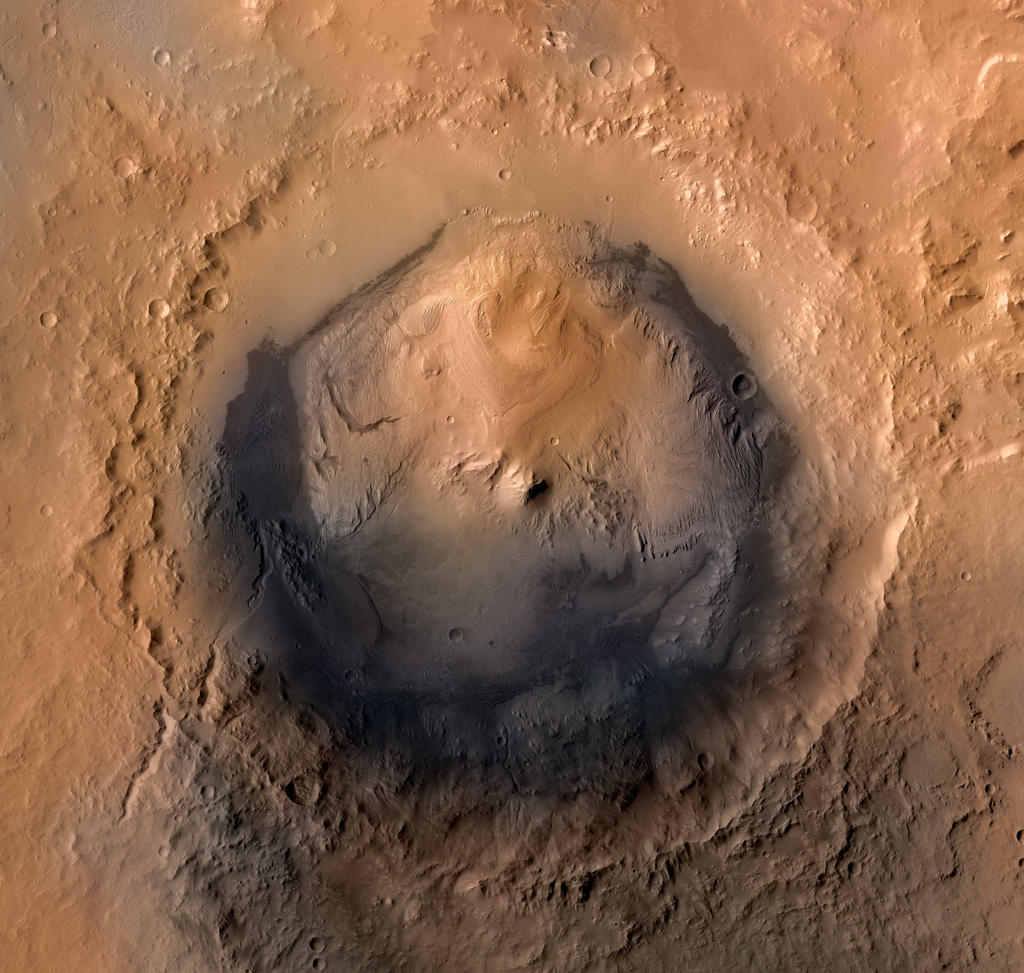
2:50 p.m., Oct. 28: An earlier version of the caption for the color image above incorrectly said the image was created by a High Resolution Stereo Camera. It should have said: "Color image of the Gale Crater created by a combination of images from the Viking spacecraft and the Mars Reconnaissance Orbiter."
Generating the terrain: Building something out of nothing
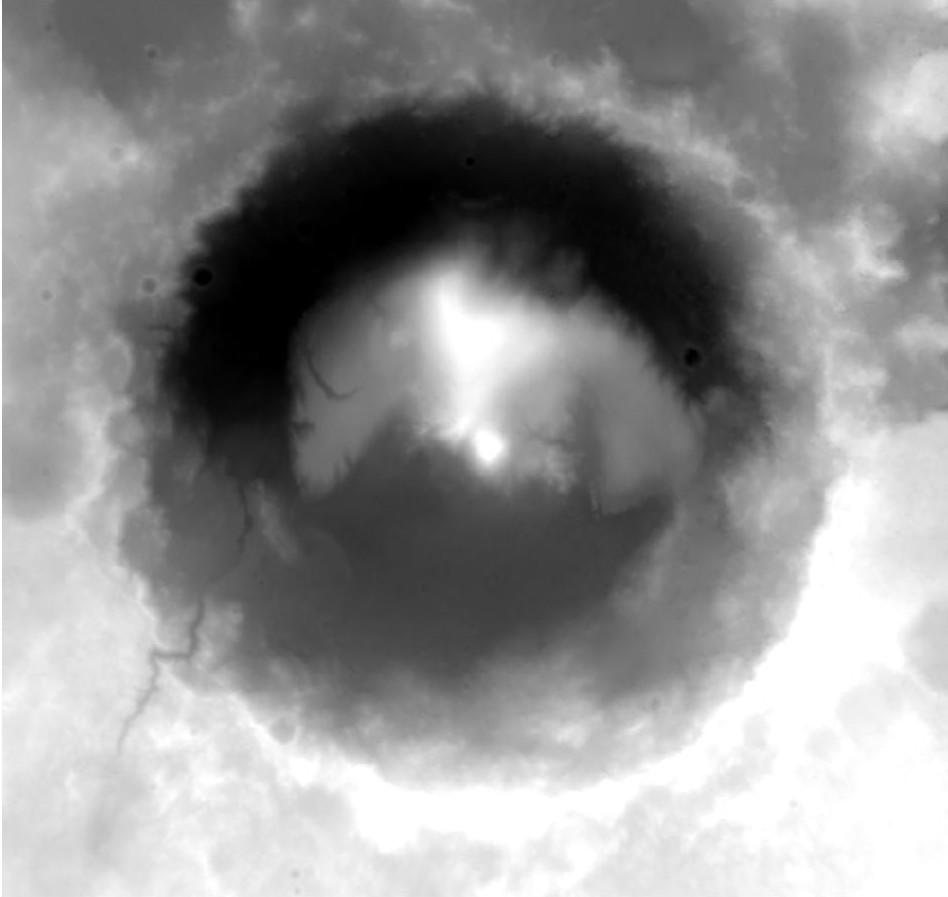
To start, we received two key pieces of data from NASA - a digital elevation model (DEM), and a high-resolution image of Gale Crater. A DEM is basically an image, in this case a GeoTIFF, where elevation is associated with color - the brighter the pixel, the higher the point at that location.
Browsers generally can't load TIFF images, however, and converting to a PNG would provide only 256 different height values per pixel. As is usually the case when working with code, however, somebody's probably run into the same problem you have. In this case, Bjørn Sandvik outlines converting a DEM to a ENVI format, which uses 16-bit unsigned integers, providing 65,536 possible height values.
We used the GDAL GIS library to convert the TIF to an ENVI. First gdal_info finds the size of the DEMin pixels and minimum and maximum height values, which we then use in the gdal_translate command, which creates the ENVI file.
gdal_translate -scale 600 1905 0 65535 -outsize 300 285 -ot UInt16 -of ENVI Gale_HRSC_DEM_50m.tif Gale_HRSC_DEM_50m.bin
You'll notice we specified the -outsize parameter, which specifies the number of data points in the output file, and the number of vertices in the plane in the Three.js scene. This can be as high or low as you want, but you'll find that larger values can be very taxing on the graphics processor when rendering the scene. We found that using 300 x 285 provided a good amount of detail without stressing out the GPU too much. For phones, we used a smaller file, 200 x 190, and for some phones even went to a 100 x 95 file, to ensure that the interactive ran smoothly.
Creating the scene with Three.js
There are many excellent guides to getting started with Three.js, so I'll skip straight to loading our terrain data into the scene.
Sandvik also has an excellent explainer on how to load the .bin data into a Three.js scene. Basically, we want to create a plane with an equal number of vertices to points in our terrain data file. Below is a simplified version of the code we used for this project.
var terrainLoader = new THREE.TerrainLoader(),
terrainURL = 'path/to/terrain_data_file.bin';
terrainLoader.load(terrainURL, function(data){
var textureLoader = new THREE.TextureLoader();
// The first two numbers are generic "units" Three.js uses for the size and width of the plane
// The second two are the number of width and height segments, equal to the dimensions of the .bin file minus 1
var geometry = new THREE.PlaneGeometry(2000, 1900, 299, 284);
// Path to satellite image of crater, to be mapped onto the plane
var textureUrl = 'path/to/terrain_texture_file_300x285.jpg';
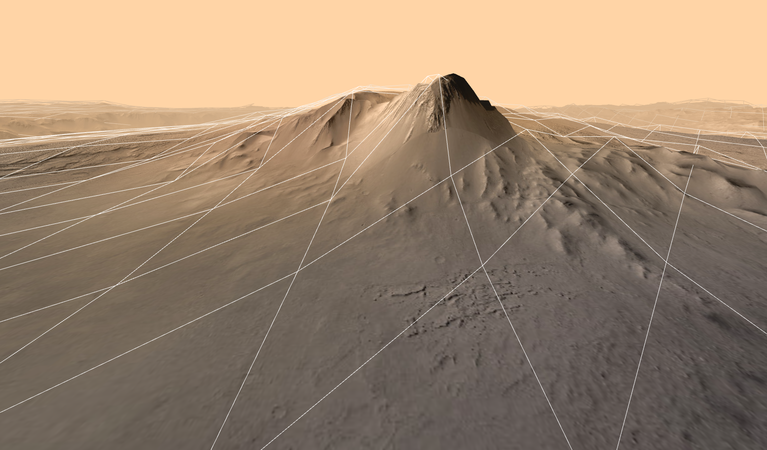
// Adjust each vertex in the plane to correspond with the height data in the .bin file
// We multiply the value by 100, exaggerating the heights (otherwise it would appear very flat and boring)
for (var i = 0, l = geometry.vertices.length; i < l; i++) {
geometry.vertices[i].z = data[i] / 65535 * 100;
}
// Map the image onto the plane
textureLoader.load(textureUrl, function(texture) {
var material = new THREE.MeshLambertMaterial({
color: 0xffffff,
map: texture
});
craterSurface = new THREE.Mesh(geometry, material);
// And add it to the scene
scene.add(craterSurface);
});
});
Which controls we use depend on the device the reader is using to view the page. Desktop and laptops get the "Fly" controls, which uses a combination of keyboard and mouse input to determine movement direction. Mobile devices get "VR" controls, which respond to the orientation of the device.
At this point, we also had to think about something that's common for a game developer, but not so much for a data journalist - collision detection. It wouldn't do any good to have a viewer be able to fly through Mars' surface, so we have to be able to detect when the camera intersects with the terrain. For this, we used a technique called raycasting, which draws a ray (a line that extends infinitely from an endpoint - don't you remember high school geometry?) and tests whether the ray intersects with an object, in this case the crater surface. Raycasting on a complicated surface can be very expensive for the graphics processor, and in this case raycasting against the crater surface you see in the interactive sent the frame rate plummeting.
Instead, we created a much simpler plane, of only 40 x 38 segments, for the surface we used for collision detection and loaded that as an invisible object in the scene. This allowed for pretty reliable collision detection, while keeping the frame rate closer to the magic 60 frames per second (in reality we were usually closer to 50-55fps) in the browser. Slower framerates create laggy response to controls, and in the case of head movement, can incur disorientation and nausea in the user.
In the code below, note the setting visible: false - we can add invisible objects to the scene and interact with them normally.
var collisionSurfaceURL = 'path/to/terrain_texture_file_40x38.jpg';

// Load in the plane that we're going to use for collision detection
terrainLoader.load(collisionSurfaceURL, function(data) {
    var geometry = new THREE.PlaneGeometry(2000, 1900, 39, 37);

    for (var i = 0, l = geometry.vertices.length; i < l; i++) {
        geometry.vertices[i].z = data[i] / 65535 * 110 + 2;
    }

    var material = new THREE.MeshLambertMaterial({
        color: 0xffffff,
        wireframe: true,
        visible: false
    });

    collisionSurface = new THREE.Mesh(geometry, material);

    scene.add(collisionSurface);
});
Splines, splines, everywhere a spline: Making the tour
At this point, we have created a scene and some ways to move around in it. But we wanted to make this a full multimedia experience, with the user also able to take a tour of the points of interest identified by NASA and explore on their own. That meant programming a route for the camera during a "tour" of the crater.
To do this, we created used Bezier curves (which Three.js has a handy function for) to create a curved spline between two points of interest. We can't simply move the camera from point A to point B, however, or we won't be able to see what we were trying to look at in the first place. So after we create the Bezier curve, we walk backwards along the points of the curve until it's an acceptable distance out to see the point we're trying to look at - you'll just have to try and experiment for what works for you.
Hang on, because this gets a little complicated. The functions below are methods of a main tour object, that contains a lot of the methods and properties used during the tour:
// Create a spline that will be used to interpolate camera movement between two points
setSpline: function() {
    // create a rotation matrix for the object so the camera knows where to look
    var m1 = new THREE.Matrix4();
    var q = new THREE.Quaternion();
    q.copy(camera.quaternion);
    m1.lookAt(camera.position, pointsOfInterest[this.curIndex].point, camera.up);
    this.splineCurve = this.makeBezierCurve(camera.position, pointsOfInterest[this.curIndex].point);
    this.spline = new THREE.Spline(this.splineCurve);
    this.segments = this.spline.points.length;
    this.splineDistance = camera.position.distanceTo(pointsOfInterest[this.curIndex].point);
    this.splineQuaternion = q.setFromRotationMatrix(m1);
    this.splineQuaternionInverse = new THREE.Quaternion().copy(this.splineQuaternion).inverse();
    this.t = 0;

    // Set the travel speed based on how far the point is
    if (this.splineDistance < 100) {
        this.speed = this.slow;
    } else if (this.splineDistance > 600) {
        this.speed = this.fast;
    } else {
        this.speed = this.standard;
    }
},
// Create a Bezier curve between two points
// Three.js requires three points so we generate a third
// which is actually v2 in the function since it's in the middle
makeBezierCurve: function(v1, v3) {
    var v2 = this.getBezierMidpoint(v1, v3);
    var curve = new THREE.QuadraticBezierCurve3(v1, v2, v3);
    var points = curve.getPoints(50);

    // walk back and trim the spline until a specified number of units out from the destination
    for (var i = points.length - 1; i > 0; i-- ) {
        if (points[i].distanceTo(v3) > 58) {
            break;
        } else {
            points.splice(i, 1);
        }
    }

    return points;
},
// Get the midway point between two vectors
getBezierMidpoint: function (v1, v3) {
    var d = v1.distanceTo(v3);
    var v2 = new THREE.Vector3();
    v2.x = (v1.x + v3.x) / 2;
    v2.y = (v1.y + v3.y) / 2;
    v2.z = (v1.z + v3.z) / 2;

    // Add a value to z, determined by distance, to give a nice curve shape
    v2.z = v2.z + d / 4;
    return v2;
},
getBezierMidpoint creates a midpoint between two vectors (think of vectors in this case as points in three-dimensional space, with x, y and z values), with the height of the curve based on the distance between the points to provide a more natural form of movement.
Meanwhile, in the animate() method of the tour, we progress the camera along the spline at a certain "speed" (also determined by the distance between the two points - move faster for longer distances, and slow down when the distance we need to cover isn't so great.) Below is a simplified version of the code in the interactive, to make it easier to read. The .ease() is an easing function to give a more natural feel of acceleration and deceleration to movement.
animate: function() {
    // extract a position on the spline, based on how much time has elapsed and how fast the camera should move
    // and reposition the camera at that point
    this.t += this.speed;
    var point = this.ease(this.t / this.splineDistance);
    var pos = this.spline.getPoint(point);
    camera.position.copy(pos);

    // Slowly rotate the camera quaternion to point to the object, if not idling
    camera.quaternion.slerp(this.splineQuaternion, this.rotationSpeed);
}
Wait, wait, wait. What's a quaternion? Well, we don't just have to move the camera between two points, we also have to make sure it's looking where we want it to as well. A Quaternion() is Three.js's implementation of quaternions, which can be used to represent rotation in three-dimensional space.
To rotate the camera to look at our point of interest, we "slerp" the quaternion (again, think of it as rotation) of the camera with the quaternion of the spline, which provides a smooth rotation between one quaternion and another. In case you're wondering, "slerp" stands for spherical linear interpolation. Math!
At 60 frames per second, this creates a pretty smooth animation between the two points. With these methods, we can create points anywhere in the scene, allowing us to add, remove or rearrange points from the tour. The helper functions take care of the rest.
Caveats and pitfalls of HTML5 webapps
While we felt that developing an in-browser app would provide the lowest barrier to entry for people to enjoy the experience, it came with its own significant pitfalls. First of all, browser chrome (the header and footer) can take up a significant amount of space on a smaller screen, and - at least on iOS - there's no way to hide them. No way, that is, unless the user saves the page to their home screen and opens the page in what is called "standalone" mode. While you can do that with the app, and it's a rather nice experience, we don't expect anyone to jump through those hoops.
Playing media files can also be quite problematic on mobile devices, particuarly iOS. Since you can't trigger audio playing without user input, we had to sneak that initial input into an earlier user click to be able to hear audio when you approach the points of interest on the tour.
Another more amusing limitation was the fact that when developing for a device such as Google Cardboard, the user really only has one input. A lot of UX standards really are yet to be developed in this realm, so while we gave a stab at using what limited controls we have - tap to start and stop, and focus the view on an item for a certain amount of time to trigger audio - we expect this will become more refined in the future.
What's next?
So what have we learned from this? Is VR the future of journalism? Well, it depends, and there are still some pretty significant limitations. First of all, the number of devices in use is limited, and many of them are projected to be quite expensive - not for the average consumer. One of the great things about Cardboard is that it's cheap and accessible, and it'll be interesting to see if the method sees widespread use.
A serious limitation so far is that even when the interactive ran smoothly, it's fairly disorienting for most people to experience in a VR device, and it wasn't uncommon for people to feel dizzy. Addressing this will be a major challenge for VR experiences to go mainstream.
This was a good first step into the world of VR for us, and given us ideas to the types of stories we want to tell next, and new approaches we'd like to try. Stay tuned.