How what you eat demands more water than you think it does
California's crippling drought has prompted conservation efforts, such as replacing grass lawns and minding how long you leave the tap water running. But what about the food on your plate? Agriculture uses 80% of California's water supply, and producing what you eat can require a surprising amount of water. The number next to the plate below represents the direct and indirect amount of water required to produce your food plate, based on U.S. data from the Water Footprint Network. Food items are assumed as fresh (unfrozen) and do not include the footprint for cooking (when applicable).

Fruits and vegetables: 0 gallons
Drink: 0 gallons
Starch: 0 gallons
Protein: 0 gallons
How much water is used to produce your food?
Cutting animal products from our diet can significantly help water conservation efforts, but water policies focus on sustainable production rather than sustainable consumption, water management expert Arjen Y. Hoekstra says in a recent report.
According to data of U.S. averages for production from the Water Footprint Network, a Dutch nonprofit research group Hoekstra co-founded, animal products demand considerably higher amounts of water than do most other food types. The selected foods below provide a representative example based on common diets. (Looking for nuts?)
Fruits and vegetables
Drink
Starch
Protein

For the record: The value for soy milk has been corrected. The original value was for the soy bean ingredient, not the actual water footprint of final soy milk product.
How the foods compare:
Additional Credits
Lorena Iñiguez Elebee, Len DeGroot, Raoul Ranoa, Anthony Pesce, Thomas Suh Lauder
Photos by Anne Cusack and Kirk McKoy, Los Angeles Times
Methodology
Read our introductory guide to understanding food water footprints.
U.S. averages are derived from weighted totals (in cubic meters per metric ton) of multiple farming methods, including grazing and industrial production.
Totals were converted to U.S. gallons per ounce (weight). Beverage values were additionally converted into fluid ounces using the USDA National Nutrient Database for Standard Reference.
All food items are assumed as fresh (unfrozen) and do not include water for cooking. Data for sheep meat in the U.S. are unavailable and global averages were used instead.
Food items were selected if typically eaten as part of a main meal. Some were omitted for simplicity (i.e., squash versus pumpkin). Nuts were not included in this project but data is available here.
Sources:
WaterStat, Water Footprint Network, Enschede, the Netherlands.
M.M. Mekonnen and A.Y. Hoekstra (2010), "The Green, Blue and Grey Water Footprint of Crops and Derived Crop Products," and "...of Farm Animals and Animal Products," Value of Water Research Report Series No. 47 and 48, UNESCO-IHE, Delft, the Netherlands.
L.A. Times reporting
 California's worsening drought
 How your litter ends up in the ocean
 L.A.'s aging water pipes
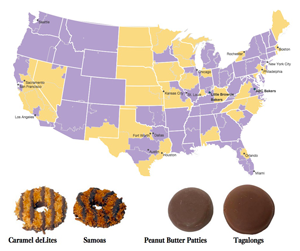 6 Girl Scout Cookies you thought you were getting but aren't